QUESTO GLOBAL SRL
In-depth credit rating for the year 2026
Company deep grade is:
BBB+
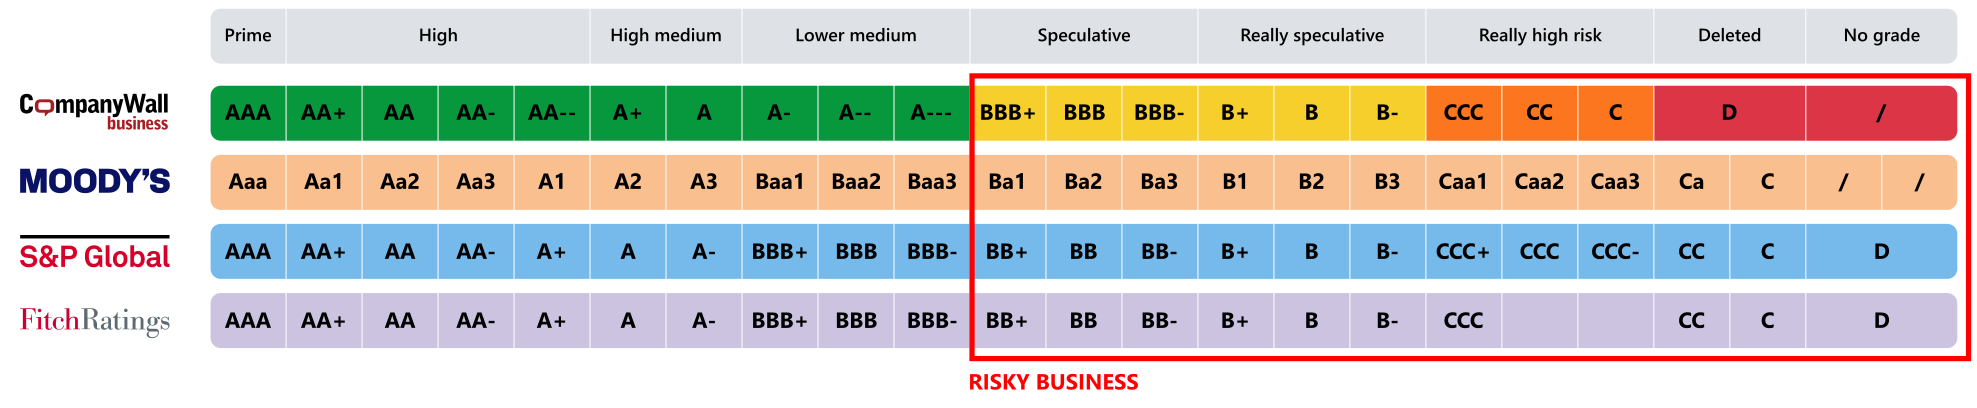
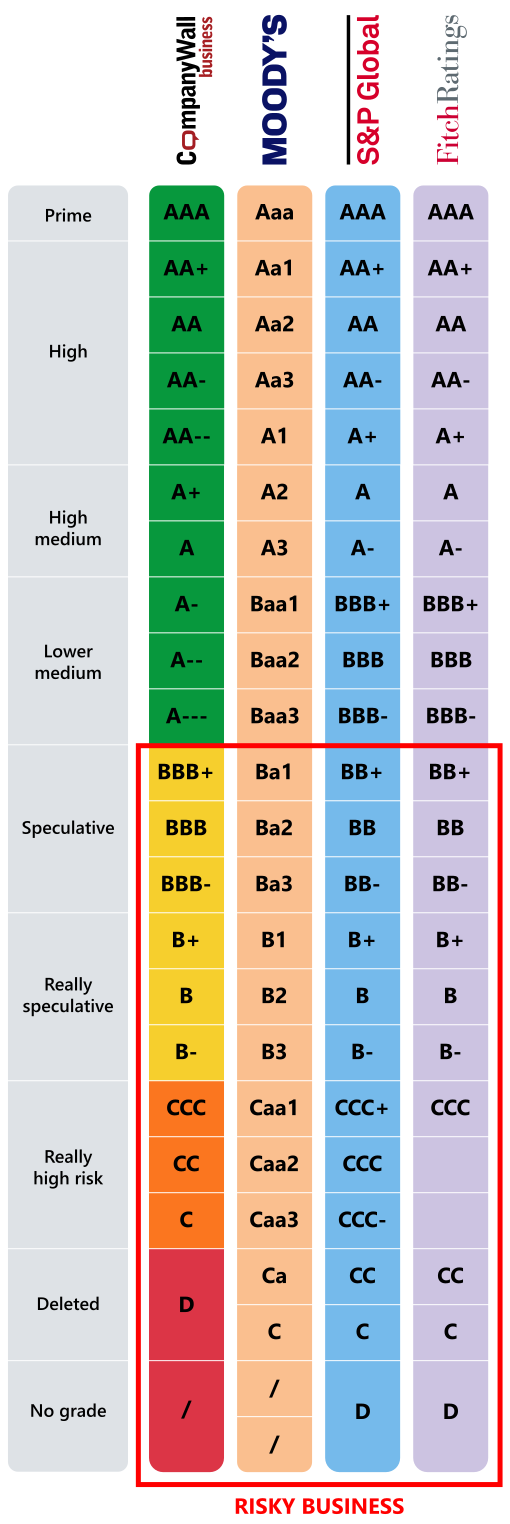
Speculative
Stability with potential risks
Companies with a BBB+ credit rating operate stably, but face certain risks that may affect their long-term growth and development. These companies are still reliable business partners, but it should be remembered that they are not immune to economic fluctuations or changes in the industry.
With this rating, companies demonstrate solid financial stability and the ability to cope with challenges. However, occasional financial fluctuations or exposure to external factors that may affect their business results are possible. Although they have a good capacity to overcome crises and adapt to new market circumstances, these companies require closer monitoring in terms of their financial indicators and business plans.
The BBB+ rating indicates that these companies have experience of overcoming difficulties and long-term growth potential, but it is necessary to consider possible challenges in their business.
In business relations with such companies, it is important to be aware of the changing circumstances and adaptability of these companies to the market, which makes them stable, but subject to certain risks.
In-depth credit rating is a deeper insight into a company's operations, where we can see the business performance for each indicator, which forms the basis for the credit rating result.
With companies that have most of their ratios in the red part of the table, we must proceed with caution, while companies with most of their ratios in the green part represent a safer business risk, and we can interpret that they will be able to meet their obligations to you.
In-depth business analisys
|
Value |
Rating |
Formula |
Final points |
|
| Current liquidity ratio | 0.26 |
C-
|
Short-term assets Short-term liabilities |
1 |
| Reduced liquidity ratio | 0.10 |
C-
|
Monetary assets Short-term liabilities |
1 |
|
Value |
Rating |
Formula |
Final points |
|
| Ratio coverage of fixed assets | -1.97 |
C-
|
Capital Fixed assets |
1 |
| Ratio coverage of real property | -0.97 |
C-
|
Long-term capital Real assets |
1 |
| Racio covers the stock with NOK | 100.00 |
AAA
|
NOK Supplies + AVR |
20 |
| Ratio of current asset coverage with NOK | 100.00 |
AAA
|
NOK Current liabilities |
20 |
| Debt ratio | -2.03 |
AAA
|
Total liabilities Capital |
20 |
| Ratio of interest coverage with earnings | / |
/
|
EBIT Paid interest |
/ |
|
Value |
Rating |
Formula |
Final points |
|
| Business asset turnover ratio | 3.74 |
AAA
|
Sales revenue Average business assets |
20 |
| Fixed asset turnover ratio | 2.56 |
AA--
|
Sales revenue Average fixed assets |
16 |
| Capital turnover ratio | 295.57 |
AAA
|
Sales revenue Average equity |
20 |
| Current asset turnover ratio | 3.74 |
AAA
|
Sales revenue Average current assets |
20 |
| Inventory turnover ratio | 100.00 |
AAA
|
Sales revenue Average supplies+AVR |
20 |
| Accounts receivable turnover ratio | 5.10 |
BBB-
|
Sales revenue - external Average accounts receivable |
8 |
| Accounts Payable Turnover Ratio | / |
/
|
Total purchases Average accounts payable |
/ |
|
Value |
Rating |
Formula |
Final points |
|
| Rate of gross business profit | 0.00 |
C-
|
Gross operating profit Sales revenue |
1 |
| Rate of net business profit | 0.00 |
C-
|
Net operating profit Sales revenue |
1 |
| Net profit margin ratio | -0.31 |
C-
|
Net gain Sales revenue |
1 |
| Gross profit margin ratio | -0.14 |
C-
|
Net profit + Interest expenses * (1 - Tax rate) Sales revenue |
1 |
| ROA | 0.00 |
C-
|
ND + TK * (1 - SP) Average assets |
1 |
| ROE | -91.37 |
C-
|
Net gain Average net equity |
1 |